Air quality
Ministry for the Ecological Transition and the Demographic challenge
Definitions
-
National Air Quality Index (AQI):
The National Air Quality Index (AQI) shows air quality at a given moment recorded at the air quality monitoring stations around Spain. It uses real-time data from these stations, reported hourly by the air quality networks and supported, if necessary, by modeled data on air quality from the EU Atmosphere Monitoring Service (Copernicus Atmosphere Monitoring System - CAMS). Using a regulated methodology, the AQI is calculated from the concentrations of up to five key pollutants recorded at each measuring station: nitrogen dioxide (NO2), sulfur dioxide (SO2), tropospheric ozone (03) and suspended particles - PM2.5 and PM10. The air quality index is calculated with the following temporal average: for NO2 and SO2 the average concentration over the last hour, for O3 the moving average of the concentrations over the last 8 hours and for PM10 and PM2.5 the moving average of the concentrations over the last 24 hours. The air quality category is determined by the worst measured value of these five pollutants and depending on the category, health messages are sent out.
-
Air quality good:
Air quality is satisfactory and outdoor activities can be enjoyed as normal.
-
Air quality reasonably good:
Air quality is acceptable and pollution does not pose a health risk.
-
Air quality moderate:
Air quality probably does not affect the general population, but may present a moderate risk for risk groups and sensitive individuals.
-
Air quality unhealthy:
The entire population could experience adverse health effects and risk groups much more serious effects.
-
Very unhealthy air quality:
Emergency situation for public health. The entire population could be seriously affected and should consider limiting outdoor activities. Risk groups and sensitive people should limit all outdoor activity.
-
Extremely unhealthy air quality:
Emergency situation for public health. The entire population should limit outdoor activity because they could be seriously affected. Risk groups and sensitive people should avoid remaining outdoors for long periods.
-
Pollutants with worst values:
Air quality is determined by the pollutant with the worst measured value. This pollutant is shown in the dashboard when it results in unhealthy, very unhealthy or extremely unhealthy air quality.
-
Measuring stations:
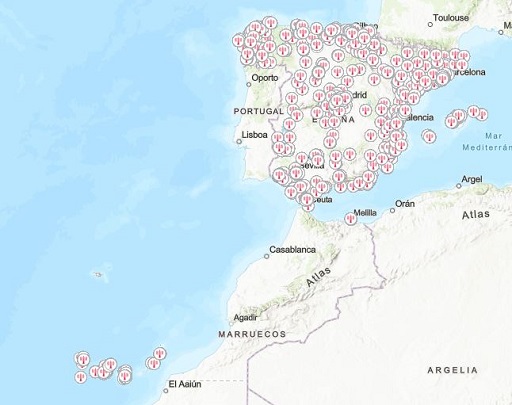
They are more than 600 points where pollutant measurement are taken and they make up the air quality monitoring networks. Their location is determined by the criteria established in RD 102/2011, of 28 January, regarding the improvement of air quality.
-

Tourism data publication schedule for 2025
29 January 2025 -

What is the quality of bathing water at your holiday destination for this summer?
02 July 2024 -

The Protection of Nature in Spain and in its Tourist Destinations in Figures
23 November 2023 -

Keys for Data Exchange in Tourism: the Role of Data Spaces
19 July 2023


