

The Protection of Nature in Spain and in its Tourist Destinations in Figures

Figures and Charts about Nature Protection in Spain
The Dataestur dashboard reflects the status of the natural environment in Spain providing the main protection figures and the protected municipal surfaces, forests, trees and risk of flooding or damage caused by nitrates.
Protected Nature in Spain and its Autonomous Regions
The "Overview" and "Analysis" of Dataestur's "Nature Protection" snapshot provides several indicators to monitor nature protection in Spain based on data from the Nature Data Bank managed by the Ministry of Ecological Transition and Demographic Challenge.
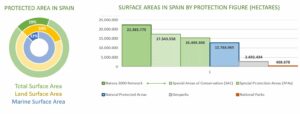
Here, it is possible to consult the total protected area in the country, as well as its terrestrial and marine protection and changes in recent years. It is also possible to monitor the main protection figures, in other words: Biosphere Reserves, National Parks and Geoparks.
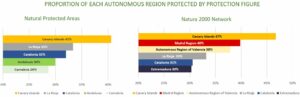
Information on the number of spaces protected by each type of declaration and the corresponding number of hectares is available per autonomous region. As a result, the weight of each region at a national level for each type of protection or the percentage of the autonomous region protected can be consulted.
For example, Andalusia and the Canary Islands are amongst the autonomous regions that account for the highest percentage of National Parks and Geoparks in Spain.
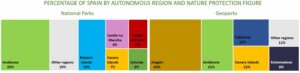
The case of the Canary Islands is particularly relevant when it comes to the degree of protection of its nature, as it accounts for a significant proportion at a national level given the large percentage of protected land, despite the fact that it only represents around 1.5% of Spain's surface area. La Rioja and Catalonia are also worth note for the high percentage of protected area in their territories.
The data is updated annually and during the last quarter, statistics are published for the previous year.
Municipal Data on Nature Protection
The Dataestur dashboard allows you to consult the percentage of protected area in any municipality based on the data held by the Integrated Municipal Data System at the Ministry for Ecological Transition and the Demographic Challenge. It also offers information on forest surface area, the percentage of trees and the analysis of two possible environmental risks: the floodable surface (at risk of temporary and exceptional flooding due to overflowing water flows) and the surface area affected by nitrates (areas vulnerable to contamination caused by nitrates used in agriculture).
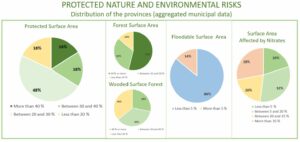
All this data can be grouped by autonomous regions and by provinces to ascertain the percentage of surface areas protected, forested, floodable or affected by nitrates.
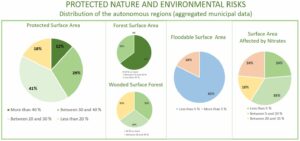
The data shows that more than 80% of the autonomous regions have nature protection on more than 20% of their surface area. The Canary Islands are worth particular note, with nearly 70% of the surface area in their municipalities protected. Furthermore, all autonomous regions have at least 35% forest surface area.
When analysing the possible risks posed by the natural environment, these are mainly concentrated on the Mediterranean coast. The floodable surface area only comes to around 10% in the Region of Valencia and the Region of Murcia. However, around 50% of the surface area in Region of Valencia, Catalonia and Castile-La Mancha is affected by nitrates, followed by the Region of Murcia, which is close to 40%. In regions such as Cantabria, Galicia, the Basque Country or the Principality of Asturias, this risk is practically non-existent.
When combining municipal data by province, it is possible to identify those where more than half of their surface area is protected. These are the cases of Santa Cruz de Tenerife (69%), Las Palmas (68%), Lugo (75%) and Huelva (50%). At the opposite end of the scale are Pontevedra (5%), Gipuzkoa (13%) and Seville (15%).
Valencia is worth particular mention as the province with the most floodable surface area (close to 15% and with up to 25 municipalities where half of the surface area is floodable). It is followed by the Region of Murcia, Seville and Alicante, where around 10% of their surface area is floodable. Seville and Alicante each have up to 9 municipalities where more than 50% of the surface area is floodable.
The different filters available in the dashboard make it possible to discriminate between municipalities based on their population or degree of urbanisation. In this way, urban centres or rural areas can be identified for monitoring or comparison.
Consideration must be given to the fact that the data from the Integrated Municipal Data System is extracted from different national maps. Those used by Dataestur correspond to 2021 in relation to protected, floodable and nitrate-affected surfaces. In turn, the information on forest area is prepared using the Most Recent Forest Map of Spain, which, depending on the autonomous region, may contain information from different years ranging from 2004 to 2020.