

Figures of Tourist Homes in Spanish Destinations
Dataestur offers an analytical display of the data published by the INE
- Learn about the number of homes for tourist use (VUTs), the percentage they represent out of the total number of homes, or the number of existing VUTs based on the area of the municipality or its population.
- Asturias registered the highest increase in the last year. The Canary Islands, Balearic Islands and Catalonia have the most municipalities with a higher proportion of VUTs over total homes.
- Madrid doubles the number of VUTs of any other city, and Barcelona is the city with the lowest proportion of VUTs per tourist received among the destinations with the greatest supply of tourist housing.
Dataestur has published a new dashboard that answers questions such as: How many tourist homes are there in a municipality? What percentage of homes are used for tourist rental? How does the concentration in a given municipality compare to the surrounding municipalities? What is their growth trend? What capacity do these tourist homes have? Additionally, you can compare the data with information from any other destination in the country, from a province or from your selection of interest. It also includes indicators that link the number of existing tourist homes to the area and population of each destination.
How has the numer of tourist homes changed in the last year?
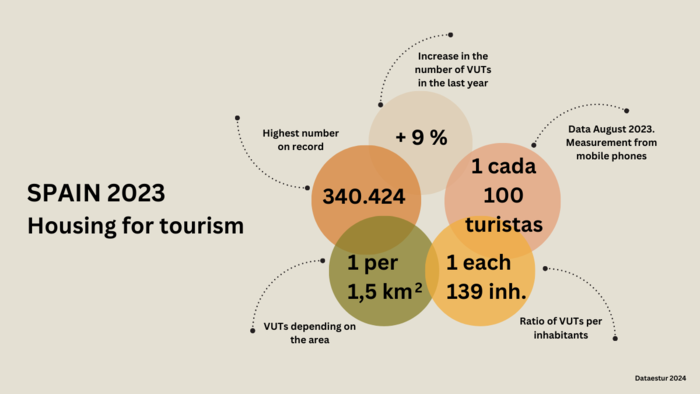
In Spain, the last year has meant a growth of more than 9% in the number of tourist homes available, exceeding 340,000 and reaching the highest figure since data became available (August 2020). These represent only 1.28% of the real estate stock. On average, and always based on the latest published data referring to last August, housing for tourist use (VUTs) has capacity for five people.
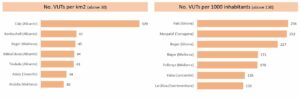
In summary, in Spain, there is approximately one tourist home for every 1.5 square kilometre and for every 139 inhabitants. Given the data from the INE's experimental statistics for measuring tourism from mobile phones, the relationship between VUTs and the number of tourists received would be one for every approximately 100 tourists arriving in August (latest data on tourist housing published by the INE)
The dashboard also makes it possible to track and calculate these indicators for any destination in the country. If we consider the autonomous regions, Asturias was the region with the greatest growth in the number of VUTs (above 14%). The region of Murcia, Galicia, the region of Valencia, Andalusia and Castile-La Mancha also registered figures above 10%. The only region where VUTs decreased was the Balearic Islands (about 2%). As for the total number of VUTs, the Canary Islands, Catalonia, the region of Valencia and, especially, Andalusia stand out.
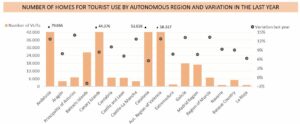
With regard to the change in the number of VUTs in the provinces, in almost half of them there has been an increase of more than 10%. This includes the whole region of Valencia, seven of the eight Andalusian provinces and three of the four Galician provinces.
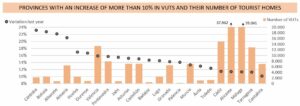
Furthermore, one in five provinces has seen an increase in the number of tourist homes by over 15% and Cordoba, Biscay, Albacete and Almeria have done so by over 20%.
In five provinces, the data for August 2023 is lower than the previous year. Two are from the Basque Country.

What are the municipalities with highest number of homes for tourist use?
Madrid is the city with the most VUTs available (over 14,000). In fact, it practically doubles the figure of the second destination with the greatest offer: Barcelona (according to data published by the INE, it has seen a reduction in housing for tourist use of more than 55% since August 2020). Nevertheless, the concentration of homes intended for tourism per square kilometre is much higher in Barcelona than in Madrid (75 versus 23); and in both cities a very similar number of homes are intended for tourist use per 1,000 inhabitants (around 4.5).
The wide availability of VUTs in Madrid exceeds that of entire autonomous regions such as Castile and Leon, the region of Murcia and Asturias, or even the sum of any of them. In terms of provinces, only Malaga, Alicante, the Balearic Islands, Las Palmas, Girona and Santa Cruz de Tenerife have a greater offer than Madrid.
In total, 17 municipalities exceeded 3,000 VUTs in the August data from the INE, and the vast majority can be found in the region of Valencia, Andalusia and the Canary Islands.
The following chart shows the number of homes for tourist use in the ten national destinations with the greatest supply. And the number of tourist homes per 100 tourists, taking into account the August data from the INE experimental statistics for measuring tourism using mobile phones.
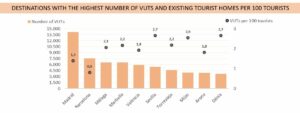
Sun and beach destinations have the greatest offer per tourist received, and the city of Barcelona stands out with the lowest value. Seville is of particular notice, a destination that usually receives less tourism in August than at other times of the year. This could cause a spike in the figure calculated in relation to tourists received. In fact, if the calculation is done with February data, the supply of VUTs per 100 tourists decreases by 0.8. Madrid could be a case with similar characteristics. However, the February result, albeit lower, is quite similar.
In the Dataestur dashboard, you can also analyse the proportion of homes per population and area at any of these destinations.
What are the municipalities with the highest percentage of home intended for tourist use?
Eminently touristic municipalities, and especially small sun and beach destinations, present a greater percentage of their real estate stock for tourist use. In Spain, homes intended for tourist use exceed 10% in almost 50 destinations. In this case, the autonomous regions with the highest concentration of these municipalities are the Canary Islands, the Balearic Islands and Catalonia and, to a somewhat lesser extent, the region of Valencia and Andalusia.
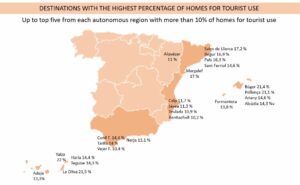
Among the destinations highlighted on the map, only Adeje (Tenerife), La Oliva (Fuerteventura), Calp and Jávea (Alicante) and Pollença (Mallorca) have around 3,000 VUTs available. Two small destinations in Mallorca stand out, with barely more than 1,000 inhabitants (Búger and Ariany). They have practically one home for tourist use for every two inhabitants. And the data only shows one destination from an inland region. Alquézar (Huesca), where its 40 homes for tourist use represent practically one for every ten inhabitants.
When we analyse the number of homes for tourist use in relation to the area of each of these destinations, those in the region of Valencia are of particular notice. Meanwhile, if we consider its relationship with the population, the outstanding values are repeated in Catalonia.
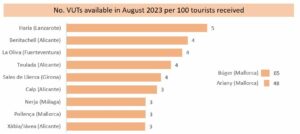
When combining the data on the number of VUTs in the destinations on the map with the measurement of tourism from mobile phones, several destinations register around or more than 3 tourist homes per 100 tourists received in August. If the average capacity of tourist homes is also considered (greater than four people in the case of Haría, for example), we could say that the tourist homes in that destination would have the capacity to accommodate around 20% of the tourists received.
Origin of the data and when the experimental statistics measuring the numer of tourist hmes in Spain are published
Dataestur's analytical display is based on the data published by the National Institute of Statistics in its experimental statistics measuring the number of homes for tourist use in Spain.
The statistics are updated twice a year. The data referring to the month of February is published in June; and the data referring to August of the same year is updated in December. Data is available since August 2020.
Likewise, the Dataestur dashboard complements the information published by the INE with the calculation of the relationship between the number of tourist homes available and the area and population of tourist destinations. Finally, it incorporates reference to the data on prices of tourist homes in 2022.